The fight against malnutrition – commitments and financing


- Government spending on nutrition has increased in some developing countries, the Nutrition for Growth (N4G) financial commitment of US$19.6 billion has been met and there are initiatives with the potential to deliver finance at scale. However, official development assistance (ODA) to address all forms of malnutrition remains unacceptably low. A step change in the level of investment is needed to respond to the challenge of global malnutrition in all its forms and to deliver on national nutrition plans.
- Nutrition-specific spending is particularly low. There is considerably more donor investment in nutrition-sensitive approaches and programmes with declining funding for nutrition-specific investments. Donors need to prioritise investing in nutrition-specific and nutrition-sensitive programmes equally. A modest step forward has been made in donor spending commitments on obesity and diet-related non-communicable diseases (NCDs).
- Domestic spending remains opaque and difficult to track and funding levels vary widely from country to country. Clear targets need to be set for domestic expenditure according to their specific burden of disease and governments need to be supported to increase spending against targets to drive progress.
- New ways of tracking financial flows are being implemented. Uptake and use of the codes and marker developed to improve future tracking of nutrition financing by aid donors are essential and require concerted action by all donors to use them consistently in their reporting.
- While estimates of the funding gap vary, nutrition finance needs to be delivered at scale to meet the challenges. Innovative mechanisms and business investment are needed to supplement government finance. The Power of Nutrition initiative is an encouraging example which aims to unlock US$1 billion of new financing for undernutrition by 2022 and the World Health Organization (WHO) has launched a new investment framework for NCDs.
- There is strong momentum to address malnutrition through commitments made globally – Sustainable Development Goals (SDGs), the UN Decade of Action on Nutrition 2016–2025 and the Milan Global Nutrition Summit in 2017. Despite this, progress in reporting against the N4G 2013 commitments is waning with only two years to go to reach them. Urgent action is needed now to get them back on track ahead of the Japan 2020 N4G Summit.
In this chapter we track public sector spending (both internationally and nationally) on nutrition and whether this meets the need to end malnutrition in all its forms by 2030. The chapter shows some progress in nutrition financing, particularly from domestic governments and multilateral institutions, as well some new donor commitments and technical improvements to the way nutrition financing is tracked through ODA. We assess advances in the amount spent, the adoption of two new tracking processes, how the N4G progress on commitments is faring, and new commitment opportunities. The nutrition challenge will not be achieved only by public funding. The Global Nutrition Report recognises the need to look at non-public sector investments and plans to increase its analysis in this area in the future.
Finding the money for nutrition action is clearly a massive challenge. The seminal World Bank Investment Framework[1] published in 2017 calculated that US$7 billion is needed each year to deliver nutrition services that will help achieve global targets for stunting, anaemia and breastfeeding by 2025 and to enable the scale-up of treatment for wasting. Other efforts to understand the world’s needs to address malnutrition estimate this is even higher, taking into account broader actions to address undernutrition to achieve a wider set of global goals such as SDG 2.[2]
Expanding the burden even further, where are the necessary funds to tackle obesity and diet-related NCDs? To address this question, in 2018 WHO published a new Investment Framework for NCDs[3] and led a global dialogue on financing for prevention and control of NCDs.[4] If we include the investments needed to address obesity and diet-related NCDs, as reported by the Lancet Taskforce on NCDs and economics in 2018,[5] the costs to end all forms of malnutrition will be much higher. The global economic impact of obesity has been estimated at US$2.0 trillion or 2.8% of global GDP.[6] The global obesity pandemic also imposes costs on economic growth as a result of lost workdays, lower productivity at work, disability and death.[7]
Tracking domestic spending
To date, 47 of the 60 Scaling up Nutrition (SUN) Movement countries have conducted an analysis of how much they are spending on nutrition in their national budgets.[8] This provides an overview of what they have budgeted for nutrition-specific and sensitive investments (see Box 5.1) across sectors relevant to nutrition. Detailed methodological guidance has been provided by SUN on how these two types of investments are distinguished.[9]
BOX 5.1 What are nutrition-specific and nutrition-sensitive investments?[10]
Nutrition-specific investments are considered high impact nutrition interventions that address the immediate determinants of malnutrition. The 2013 The Lancet Series on Maternal and Child Nutrition recommends 10 direct interventions such as micronutrient supplementation or fortification, acute malnutrition treatment and exclusive breastfeeding and complementary feeding of young children.
Nutrition-sensitive investments address the underlying causes of undernutrition. They include actions from a range of sectors including: health, agriculture and food systems, water, sanitation and hygiene promotion (WASH), education and social protection. Such examples of investments might include improving the purchasing power of women, improving access to food, diversifying agriculture, advancing biofortification, promoting healthy diets, supporting breastfeeding and improving access to WASH.
So far, 25 countries have analysed nutrition spending in their budgets twice or more with Benin, Burundi, Democratic Republic of the Congo (DRC), Guatemala, Mauritania, Pakistan, Tajikistan, Viet Nam and Yemen doing it at least three times since 2015. Data trends on spending for these 25 countries show an overall increase in allocations for nutrition over the countries’ previous two budget years.[11] This increase was due to a 24% increase in nutrition-sensitive allocations which accounted for 94% of spending, compared with an 8% increase in nutrition-specific allocations[12] (Figure 5.1).
This consolidated picture hides significant differences across countries. In terms of total nutrition spending – total allocations to nutrition investments overall – 13 countries[13] are showing declines in investment while 12[14] are showing increases. Nutrition-sensitive allocations follow a similar trend with an equal number of countries decreasing or increasing their allocations and one country (Kyrgyzstan) showing no change. Only nine countries[15] are increasing their nutrition-specific allocations, including four countries doubling their allocations (Viet Nam, Mauritania, Madagascar and Nepal). Twelve countries show a declining trend in nutrition-specific allocations and four countries have not identified nutrition-specific allocations in their budget analysis (Gambia, Ghana, Liberia and South Sudan), likely because the budgets are not suitably disaggregated to enable tracking.
New data from 12 countries on nutrition-specific and sensitive investments (Figure 5.2) shows 96% of this spending is on ‘nutrition-sensitive’ actions. Some are investing in agriculture (DRC), socialprotection (Pakistan and Mauritania), water, sanitation and hygiene (WASH) (Benin); others are making significant investments in health (Tajikistan) and education (Sierra Leone).
Spotlights 5.1 and 5.2 shine a light on what is happening in Bangladesh, Tanzania and Ethiopia and how they are tracking domestic nutrition finances at the national level.
FIGURE 5.1 Domestic spending: Changes in total nutrition-specific and sensitive spending over 25 countries’ previous two budget years
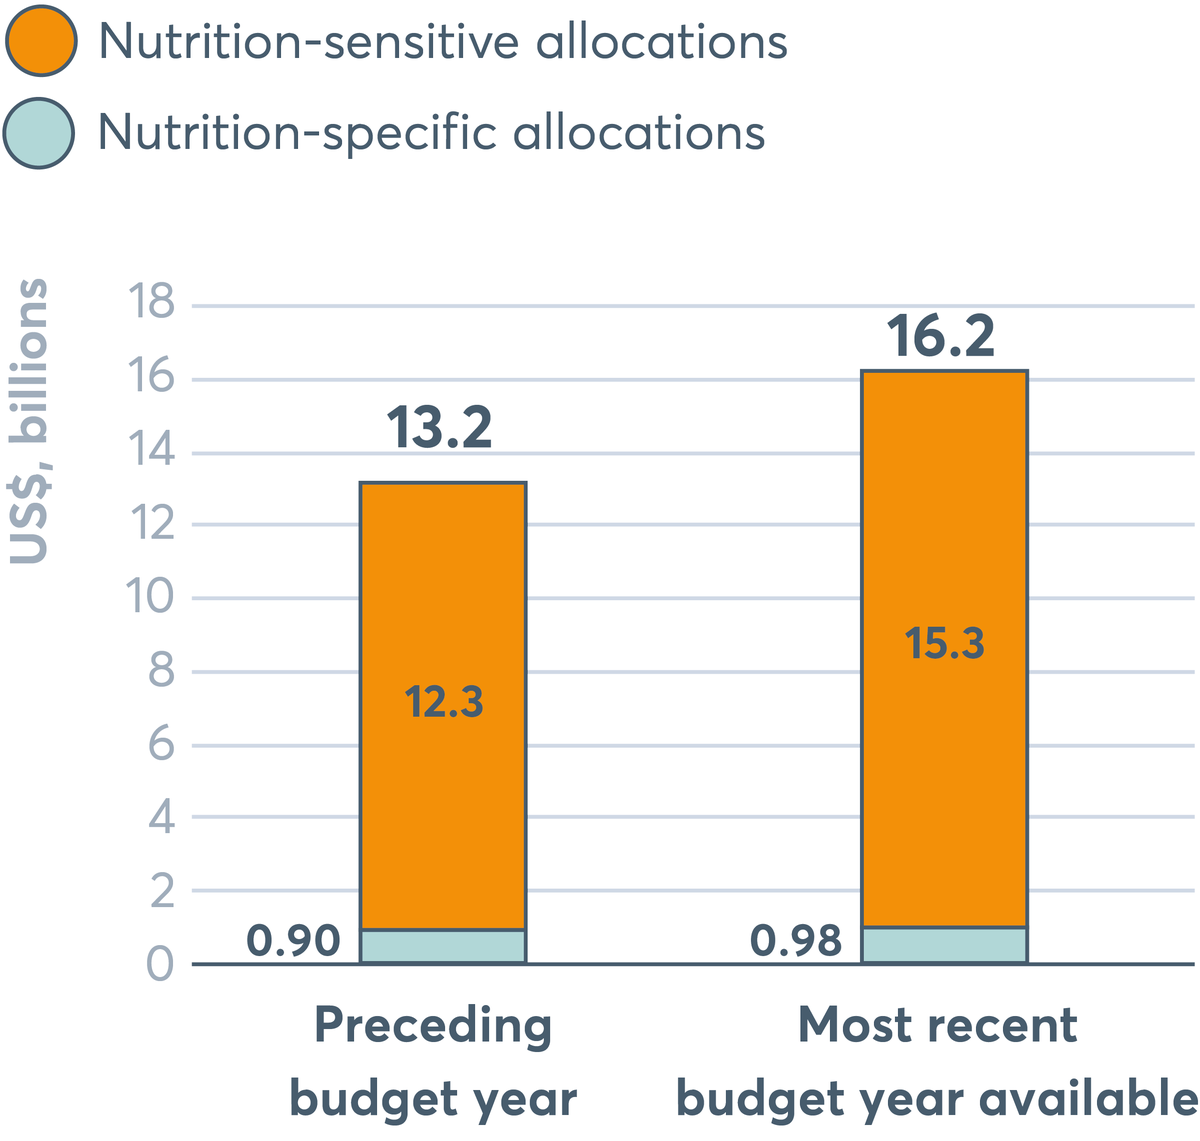
Nutrition-specific allocations have increased to US$0.98 billion in the most recent budget year available compared to US$0.90 billion in the preceding budget year. Nutrition-sensitive allocations have increased, from US$13.2 billion to US$15.3 billion.
Source: Budget analysis exercise, 2018, SUN Movement Secretariat. Notes: Based on national budgets of 25 countries (GDP deflators added to correct for inflation and express the changes in real terms).
FIGURE 5.2 Nutrition investments by sector as a percentage of total nutrition investments
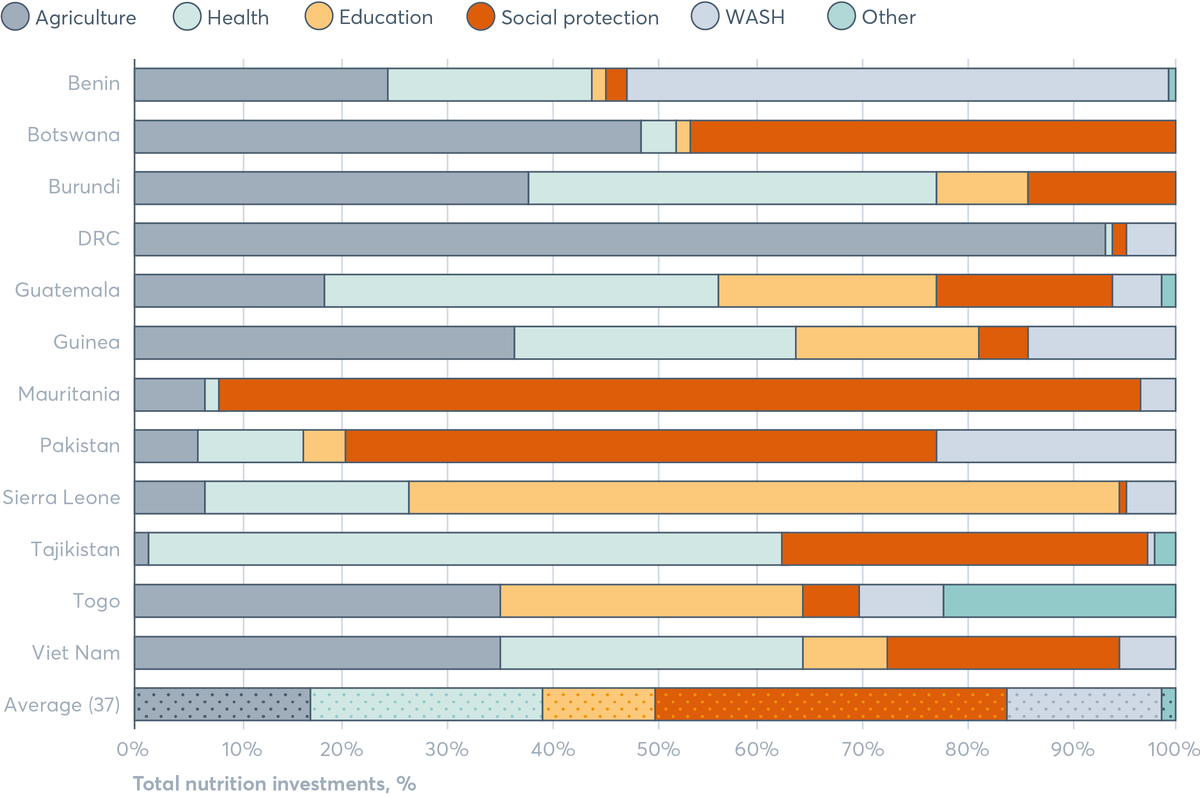
On average, nutrition investments are highest to social protection, followed by health, agriculture, WASH, education and lowest in other sectors. The proportion to each sector varies substantially across different countries. In Benin, nutrition investments are highest to WASH, followed by agriculture, health, and much lower in social protection, education and other sectors. In Botswana, nutrition investments are highest to agriculture and social protection, and much lower in health, education and none to WASH and other sectors. In Burundi, nutrition investments are highest to agriculture and health, and much lower in education and social protection, and none in WASH and other sectors. In DRC, nutrition investments are over 90% to agriculture, with minimal amounts to health, social protection and WASH, and none to education and other sectors. In Guatemala, nutrition investments are highest to health, followed by agriculture, education and social protection, with much lower investments to WASH and other sectors. In Guinea, nutrition investments are highest to agriculture, followed by health, education, WASH and social protection, with none to other sectors. In Mauritania, the vast majority of nutrition investments go to social protection, with a small amount to agriculture, WASH and health, and none to education and other sectors. In Pakistan, nutrition investments are highest to social protection, followed by WASH, health, agriculture, education, and none to other sectors. In Sierra Leone, the vast majority of nutrition investments go to education, with much lower amounts going to health, agriculture, WASH and social protection, and none to other sectors. In Tajikistan, the vast majority of nutrition investments go to health, followed by social protection. Much lower amounts go to agriculture, other sectors, and WASH, and none to education. In Togo, nutrition investments are highest to agriculture and education, followed by other sectors, WASH and social protection, and none to health. In Viet Nam, nutrition investments are highest to agriculture, followed by health, social protection, education, WASH, with none to other sectors.
Source: Budget analysis exercise, SUN Movement Secretariat, 2018. Notes: Based on 12 countries with data as of 2018. Data points range from 2015–2018. DRC: Democratic Republic of the Congo; WASH: water, sanitation and hygiene.
Drilling down on subnational spending
It is increasingly recognised that tracking nutrition investments is important at the subnational as well as the national level. A number of SUN countries have decentralised government structures, and subnational government authorities can be responsible for a sizable proportion of total spending as well as delivering key services related to nutrition (such as primary health, early childhood education, and water and sanitation). This means they can potentially make significant investments in nutrition.
Figure 5.3 provides a snapshot of this in SUN countries, showing 18 countries where subnational government spending is over 15% of total government expenditure. As Figure 5.3 shows the scale of subnational funding against national funding is varied across counties, ranging from less than 10% for some and up to 75% for others like Ethiopia and Somalia. In countries like Kenya, where subnational government spending is 16% of total government expenditure, of which healthcare makes up a disproportionate share, spending on health is greater subnationally than nationally.[16] The importance of subnational financing of nutrition is likely to increase, given that decentralisation processes are continuing across SUN countries (such as Nepal, DRC and Ghana) and better data on domestic spending is essential to improve trackability and impact of this financing.
FIGURE 5.3 Overview of subnational financing in 35 SUN countries
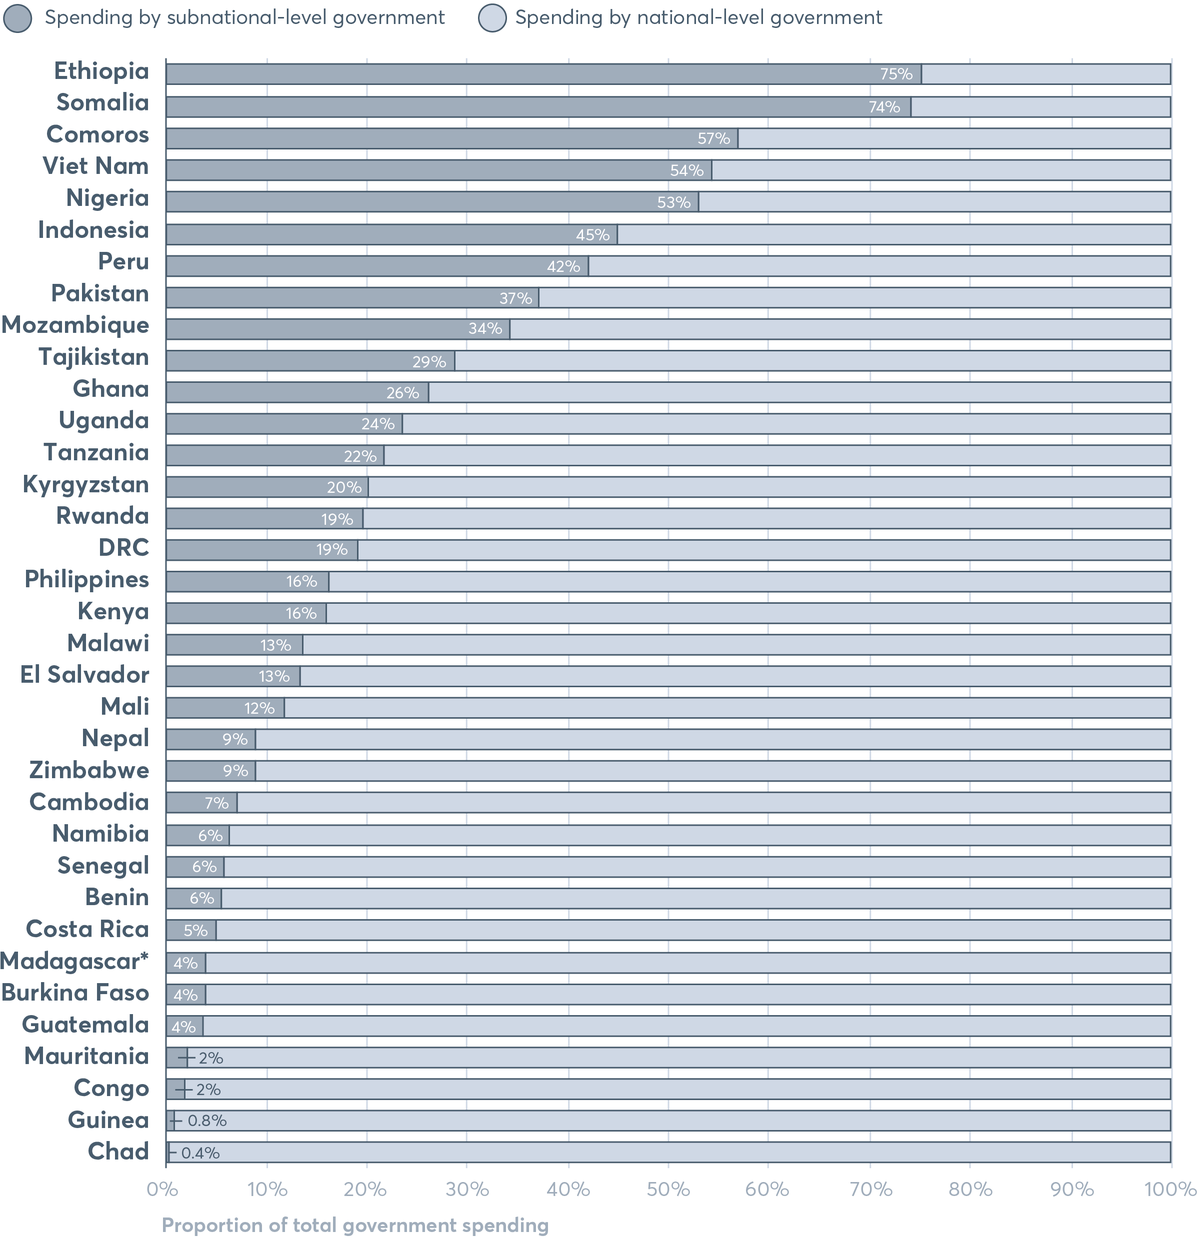
Ethiopia has the highest subnational financing of all the 35 SUN countries, at 75%. This is followed by Somalia at 74%, Comoros at 57%, Viet Nam at 54%, Nigeria at 53%, Indonesia at 45%, Peru at 42%, Pakistan at 37%, Mozambique at 34%, Tajikistan at 29%, and Ghana at 26%. Those SUN countries with the lowest subnational financing are: Chad at 0.4%, Guinea at 0.8%, Congo and Mauritania at 2%, Guatemala, Burkina Faso and Madagascar at 4%, Costa Rica at 5%, and Benin, Namibia and Senegal at 6%.
Source: SUN Movement Secretariat/Maximising the Quality of Scaling Up Nutrition (MQSUN)+ (Development initiatives/PATH), 2018, based on OECD, International Monetary Fund, World Bank, Commonwealth Local Government Forum, government financial documentation. Notes: Data points range from 2011–2017. *Data for Madagascar is from 2004. DRC: Democratic Republic of the Congo.
Tracking government expenditure in Bangladesh and Tanzania
Stephanie Allan, Clara Picanyol and Mehroosh Tak
In Bangladesh, the government approved the second National Plan of Action for nutrition for 2016–2025. However, the plan is not yet fully reflected in the budget, posing challenges to its implementation and ability to deliver on its ambition. Recognising the challenges, the government of Bangladesh aims to monitor spending on nutrition to align more closely with the plan’s priorities and reach closer to nutrition goals. In 2018, in partnership with UNICEF and with technical support from Oxford Policy Management, the government carried out a public expenditure review of nutrition programmes. It analysed the level, composition and management of budget allocations and actual spending from 2014/15 to 2017/18. The preliminary findings show that in Bangladesh, four ministries are the key spenders on nutrition (Ministries of Food, Health and Family Welfare, Primary and Mass Education, and Women and Children Affairs) and that 20 projects account for 80% of the nutrition spending in the country. Most of the spending was nutrition sensitive (98%), with only 2% nutrition specific. The review also identified significant investments funded by donors that are not being tracked in a comprehensive and systematic manner.
The government of Tanzania, in partnership with UNICEF and with technical support from Oxford Policy Management, recently completed a nutrition-sector public expenditure review. The second exercise of its kind in Tanzania, the most recent effort builds on the experience of the 2014 nutrition review to give a more comprehensive assessment of nutrition spending by covering more of the country’s 163 local governments, as well as the semi-autonomous region of Zanzibar. The public expenditure review directly analysed the budget data of a sample of 22 local governments, national-level ministries, departments, agencies and entities of the Revolutionary Government of Zanzibar, to determine the nutrition relevance budget lines as defined by the country’s policy framework – the National Multisectoral Nutrition Action Plan. In practice, this involved manually assessing a dataset of over 90,000 budget lines by a team of researchers over the course of several months. The results were then used to derive an estimate for country-wide public spending on nutrition, based on benchmarks of the average share of local government spending which is nutrition related.
The importance of subnational governments in financing nutrition has given birth to several new initiatives in this area. For example, the government of Kenya has started assessing subnational financing at county level, with similar projects taking place in Uganda, Nepal, the Indian state of Rajasthan, district governments in Indonesia and Balochistan province in Pakistan. In all of these cases, important findings have been made not only about the scale of nutrition financing in these subnational governments, but also how effective and efficient the spending has been relative to stated plans and the level of coordination with the national-level governments. For example, in the case of the state government in Rajasthan, underfunding was found in key areas, such as infant and young child feeding and micronutrient supplementation, with better targeting of resources to specific groups suggested in the future.[17] In the Balochistan provincial government in Pakistan, a lack of coherence was found across departments. As a result, the report proposed new planning and budgeting processes to improve the quality and effectiveness of nutrition-relevant investments.[18]
Tracking funding for nutrition across sectors in Ethiopia
Birara Melese Yalew, Dr Ferew Lemma, Jack Clift, Kavya Ghai and Mary D’Alimonte
The Ethiopian government’s commitment to end child undernutrition by 2030 has taken a significant step forward with the recently developed National Food and Nutrition Policy. This accountable, legal framework emphasises the right of children to adequate nutrition and normal growth and strengthens actions outlined in the National Nutrition Programme. It aims to improve the nutrition of women, adolescent girls and all children up to the age of 10 years; improve nutrition services for communicable, non-communicable and lifestyle-related diseases; strengthen implementation of nutrition-sensitive interventions; and improve nutrition coordination and capacity building across sectors.
There have been some encouraging signs of progress; for example, between 2000 and 2016 the rate of stunting in children dropped by a third. However, there is more to do as the prevalence of stunting, wasting and anaemia remain high.
Resource tracking shows which actions are being financed and which are not. The tracking analysis shows a steady rise in nutrition funding by both government and development partners from US$181 million in 2013/14 to US$455 million in 2015/16. The increase has been driven by investments in large-scale, multisectoral programmes such as the Productive Safety Net Programme and the ONE WASH National Programme. By contrast, funding for interventions focusing solely on nutrition, such as capacity building for nutrition, behaviour change communication, breastfeeding promotion, management of acute malnutrition and micronutrient programmes is relatively low. No funding has been dedicated for obesity or NCD interventions.
The Ministry of Health has initiated an annual multisectoral nutrition resource mapping exercise in routine systems to provide better data for the planning cycle. The approach has been developed to reflect lessons learned which could be useful for other countries looking to plan a resource mapping exercise. Key lessons so far include:
- being clear on how and when data will be used
- embedding nutrition resource mapping in existing health or other information systems to increase efficiency, reduce duplication and enhance sustainability
- building capacity in the public sector, other participants and implementors
- getting buy-in from government and development partners on what data to collect and how to collect it (this will also help to build ownership)
- identifying and tracking nutrition-specific components within multisectoral programmes
- consulting with all relevant sectors to ensure the data is useful to them.
The Ministry hopes that these guidelines will help other governments overcome the significant challenge of streamlining data collection, using timely information for annual planning and reporting back to development partners.
FIGURE 5.4 Percentage of total health spending by subnational governments in nine SUN countries, 2018
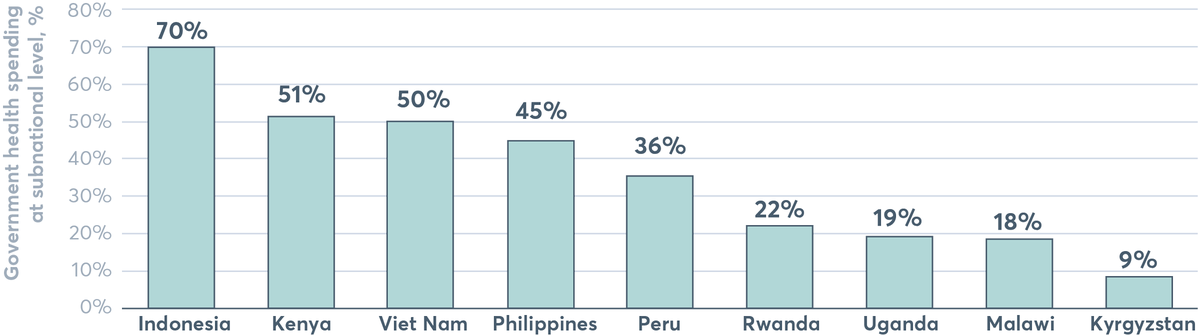
Indonesia has the highest total health spending by subnational governments at 70%, followed by Kenya with 51%, Viet Nam with 50%, the Philippines with 45%, Peru with 36%, Rwanda with 22%, Uganda with 19%, Malawi with 18% and Kyrgyzstan with 9%.
Source: SUN Movement Secretariat/MQSUN+ (Development initiatives/PATH), 2018, based on various government financial and health sector documentation, International Monetary Fund Government Finance Statistics, WHO health policy reviews.
Tracking donor financing for nutrition-specific actions
The ‘basic nutrition’ Development Assistance Committee (DAC) Creditor Reporting System (CRS) purpose code is designed to capture reported spending on direct feeding programmes, maternal feeding, breastfeeding and weaning foods, child feeding, school feeding (up to 2016), micronutrient interventions such as providing vitamin A, iodine and iron, monitoring of nutritional status, nutrition and food hygiene education, and household food security. It has in practice been shown to be an imperfect proxy for mainly nutrition-specific interventions. It is nevertheless an important tool for monitoring relevant spending (see Spotlight 5.3).[19] [20] [21]
Aid for basic nutrition reported by donors and multilateral agencies amounted to US$856 million in 2016 – almost 0.5% of total ODA. Other estimates of nutrition-specific spending are higher, at US$1.12 billion.[22] Even at the higher figure, this amounts to less than 1% of global ODA.
Figure 5.5 shows basic nutrition disbursements from ODA donors for 2007 to 2016 (the latest year available). Following a four-fold rise from 2007 to 2013, spending as stalled. Moreover, as a percentage of total ODA, basic nutrition ODA has declined annually since the spending peak in 2013. Basic nutrition ODA now represents less than half of 1% of total ODA – a relatively small share of all development assistance compared with other sectors: in 2016, 6.8% of ODA was spent on education, 4.1% on agriculture and 1.0% on malaria control.[23]
FIGURE 5.5 Basic nutrition ODA disbursements, 2007–2016
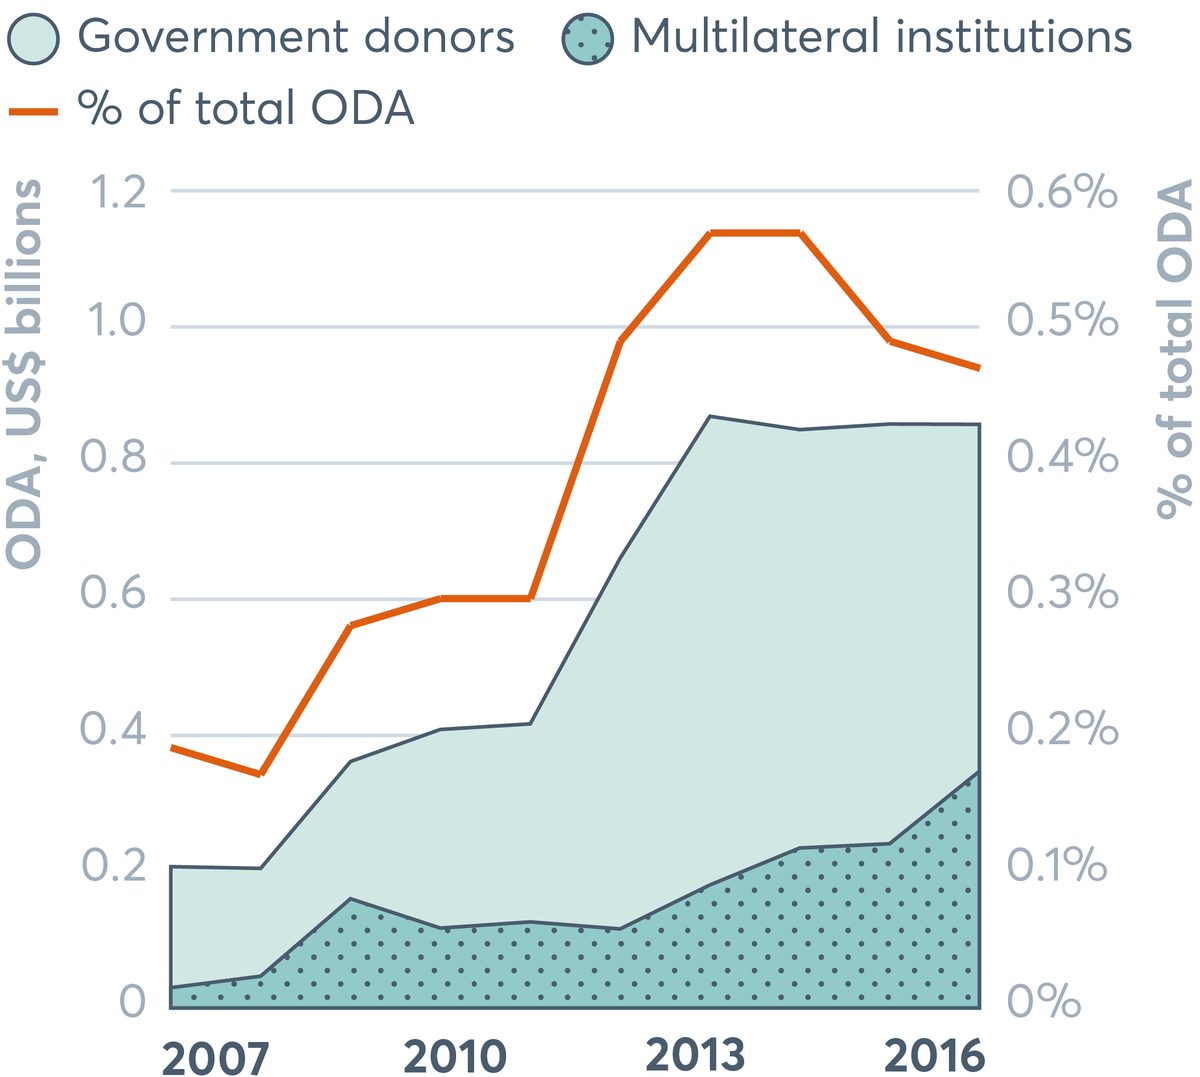
Basic nutrition ODA disbursements from government donors and multilateral institutions grew between 2007 and 2016. Basic nutrition ODA as a percentage of total ODA grew between 2008 and 2013, but then declined.
Source: Development Initiatives based on OECD Development Assistance Committee (DAC) Creditor Reporting System (CRS). Data downloaded on 11 May 2018. Notes: Amounts based on gross ODA disbursements, constant 2016 prices. Figure includes ODA grants and loans, but excludes other official flows and private grants reported to the OECD DAC CRS. Government donors include DAC member country donors and other government donors (Kuwait and the United Arab Emirates). Multilateral institutions include all multilateral organisations reporting ODA to the OECD DAC CRS.
Between 2015 and 2016, 17 donor countries reported fewer contributions while only nine spent more (Figure 5.6). As a result, bilateral aid to basic nutrition fell by US$107 million to US$509 million. But it should be noted that these apparent decreases may be a result of recent refinements to the basic nutrition purpose code whereby school feeding activities have been removed (see Spotlight 5.3). While the removal of school feeding from the basic nutrition purpose code should have taken effect as of 2016, in practice, donors may have responded and adhered to the new definition inconsistently, and so it is difficult to attribute observed changes in spending to this code change specifically.
At the same time, overall spending by multilateral institutions increased by US$106 million. The net effect is no real change in the total amount reported through the basic nutrition code.
FIGURE 5.6 Changes in basic nutrition ODA disbursements by donor, 2015–2016
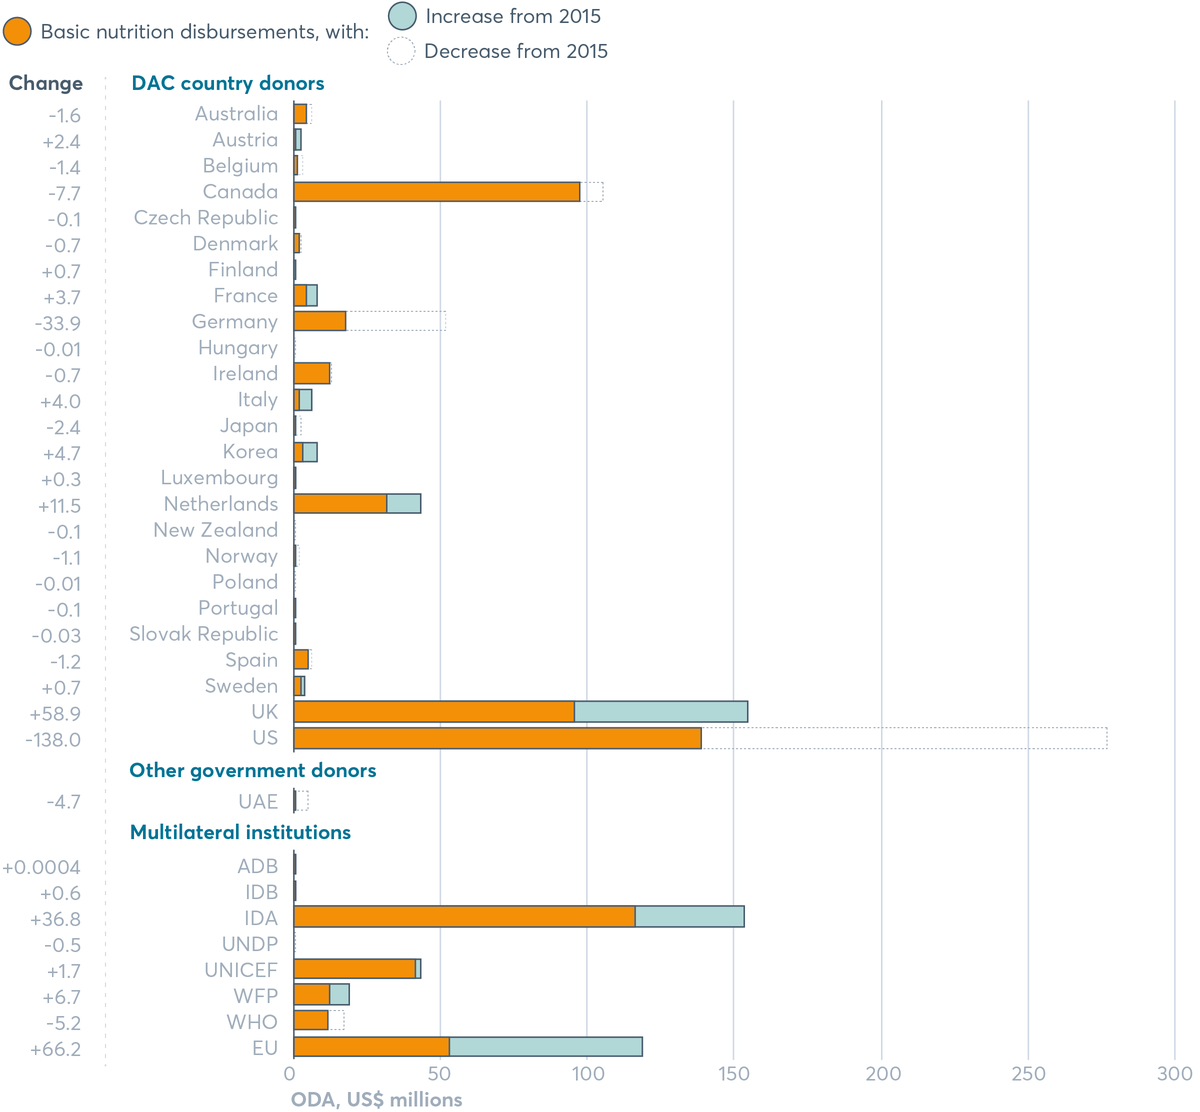
The US and the UK have the highest nutrition disbursements of all countries in 2016, but the US has seen a huge decrease since 2015 of over US$100 million and the UK has seen an increase of over US$50 million since 2015. The countries seeing small increases are Luxembourg, Austria, France, Italy, Korea, the Netherlands, Finland and Sweden. Other countries seeing small decreases include Australia, Belgium, Japan and Spain. Germany has decreased its disbursements by US$30 million. For multilateral institutions, IDA has the highest disbursements at US$153 million. This has increased by US$37 million since 2015. The EU has disbursements of over US$100 million, which has increased since 2015. UNICEF and the World Food Programme have increased disbursements since 2015, and the WHO have decreased disbursements.
Source: Development Initiatives based on OECD DAC Creditor Reporting System. Notes: Amounts based are gross ODA disbursements in constant 2016 prices. ADB: African Development Bank; IDA: International Development Association; IDB: Inter-American Development Bank; UAE: United Arab Emirates; UNDP: UN Development Programme; WFP: World Food Programme; WHO: World Health Organization. Data downloaded on 11 May 2018.
New methods to track donor spending
Nawal Chahid, Aurore Gary and Mary D’Alimonte
New nutrition purpose code
All donors report their ODA to the OECD DAC to a common set of standards and agreed definitions. ODA is classified into two levels: sectors – such as health or agriculture – and then a subset of ‘purpose codes’. The ‘basic nutrition’ purpose code in the health sector captures some nutrition-specific expenditure.
The Global Nutrition Report and others have found the basic nutrition code to be an imperfect way to track nutrition specific spending, and in 2017 a revised code was adopted with some improvements, such as the removal of school feeding to allow more accurate nutrition-specific tracking.
While the basic nutrition purpose code captures programmes whose main objective are to improve nutrition, it can miss nutrition investments integrated into broader programmes that are delivered across sectors (e.g. maternal and child health programmes that include supplementation; or agricultural programmes that include fortification). A significant amount of nutrition-specific spending is spread across other DAC codes simply due to the integrated nature of nutrition programming, which get missed by looking at the basic nutrition code alone. The code also does not capture nutrition-sensitive spending (which is tracked in Table 5.1) or spending on obesity or diet-related NCDs (Figure 5.8).
New nutrition policy marker
A major step forward for nutrition aid tracking was achieved through the adoption of a policy marker for nutrition in July 2018, thanks to a close collaboration between the SUN Donor Network, France and Action Against Hunger. Without this marker, there was no way for the CRS to monitor nutrition investments across sectors, which has been a major limitation to tracking multisectoral nutrition aid using publicly available data (and a reason why the SUN Donor Network developed its own method). Now, the nutrition policy marker – similar to the one adopted for gender equality – will allow for better accounting of progress towards the global nutrition targets including both nutrition-specific and nutrition-sensitive investments across sectors. All donors will be required to use the policy marker by 2020.
How it works: All donor projects will be evaluated for their relevance to nutrition and given a policy marker score according to how prominent nutrition is in the investment, on a three-point scale. This means investments across sectors and purpose codes that integrate nutrition activities, goals and outcomes can be identified.
The new policy marker will provide greater accountability and transparency through publicly available data for donors, researchers and civil society. For the first time, donors can systematically track how their nutrition funding – nutrition specific and sensitive – is integrated across all sectoral portfolios. It will streamline tracking of multisectoral nutrition investments by all donors and help them decide how to target interventions and strategies more efficiently to those countries that need them most. It will also enable donors to take a deeper look into the level of integration of nutrition in their wider programme portfolio.
Now that the policy marker is in place, the next step is to establish a set of guidelines to help donors implement it (similar to the gender marker process mentioned earlier). The SUN Donor Network and Action Against Hunger will continue to engage to ensure effective implementation.
The new and improved CRS code and policy marker are excellent examples of collaboration between donors, civil society and the OECD. They signal a long-term change in leadership, governance and mutual accountability to address the global challenge of malnutrition, which will benefit recipient countries, donors, researchers and civil society.
Figure 5.7 shows basic nutrition disbursements by donor, and includes private grants reported by the Bill & Melinda Gates Foundation. The UK, the US, the EU and Canada continued to top the list of DAC donors in 2016, accounting for 60% of global basic nutrition ODA. See Spotlight 5.5 on US government financing.
Some donors report significantly less spending in 2016 than 2015 on basic nutrition ODA. The US, for example, cut spending through the basic nutrition code by 50%. Germany has also cut spending via the basic nutrition code (by 65%) and Japan by 89% (Figure 5.6).
As previously noted, some of these decreases may be partly due to the recent changes to the basic nutrition purpose code (see Spotlight 5.3). Some may also be attributable to greater spending on nutrition-sensitive approaches (see Table 5.1, and Spotlight 5.5 for the US example).
New Zealand, Poland and Hungary joined Greece, Iceland, Slovenia and Switzerland on the list of countries that spent nothing at all through the basic nutrition code. On the other hand, the UK (62%), the Netherlands (36%) and Korea (142%) increased spending significantly through the basic nutrition code and Austria and Italy more than doubled basic nutrition ODA. Six of the eight multilateral institutions that report ODA to basic nutrition increased their spending. The EU is now one of the biggest multilateral spenders, followed by UNICEF and the World Food Programme.
As noted in Spotlight 5.3, the basic nutrition purpose code is an imperfect proxy for nutrition-specific spending as it only captures a subset of nutrition-specific investments. Detailed analysis by Results for Development (R4D) underlines this, and that it is impossible to identify spending aligned with the 2025 targets with the code alone. Looking beyond the purpose code, it finds that most nutrition-specific spending is aligned with the stunting and wasting targets.[24] The analysis tracks donor spending on nutrition-specific interventions against the 2025 nutrition targets[25] to monitor spending against global resource needs to achieve the targets.[26] An estimated US$1.12 billion was spent on nutrition-specific interventions in support of the global nutrition targets in 2015.[27] Most of those funds were spent on stunting reduction (US$495 million) and wasting (US$224 million) and were allocated to sub-Saharan Africa and South Asia. The majority of funding was allocated to micronutrient supplementation, treatment of acute malnutrition, nutrition counselling and research.
FIGURE 5.7 Basic nutrition ODA disbursements by donor, 2016
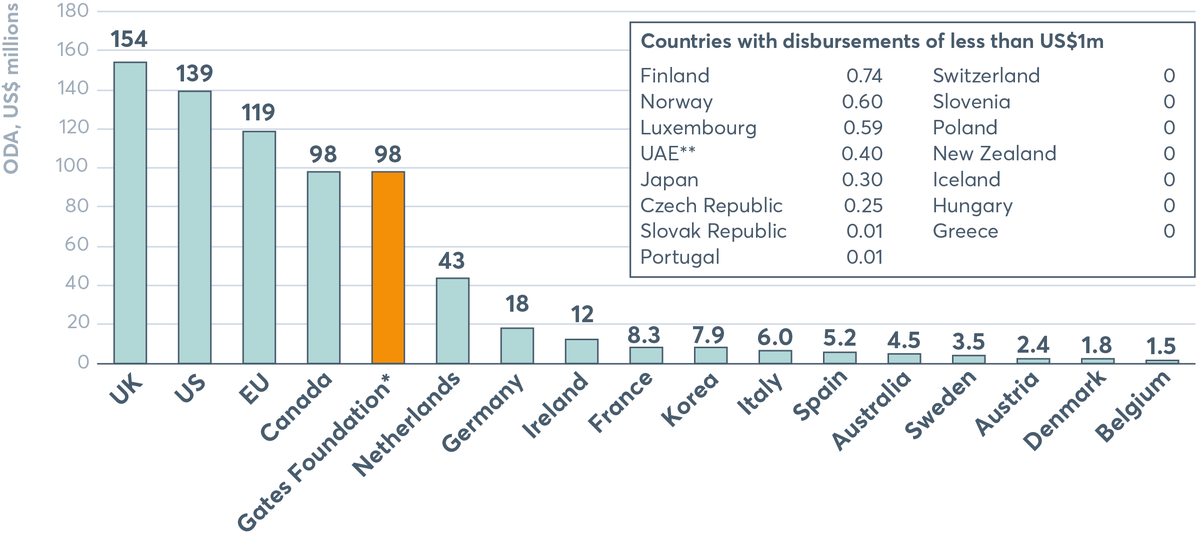
Basic nutrition ODA disbursements in 2016 were highest from the UK at US$154 million, followed by the US at US$139 million, the EU at US$119 million, Canada and the Gates Foundation at US$98 million, the Netherlands at US$43 million, Germany at US$18 million, Ireland at US$12 million, France at US$8.3 million, Korea at US$7.9 million, Italy at US$6.0 million, Spain at US$5.2 million, Australia at US$4.5 million, Sweden at US$3.5 million, Austria at US$2.4 million, Denmark at US$1.8 million and Belgium at US$1.5 million.
Source: Development Initiatives based on OECD DAC Creditor Reporting System (CRS). Notes: Amounts based are gross ODA disbursements in constant 2016 prices. *Spending by the Bill & Melinda Gates Foundation refers to private grants reported to the OECD DAC CRS. **UAE: United Arab Emirates is the only donor outside the DAC reporting basic nutrition ODA in 2016. Data downloaded on 11 May 2018.
It is clear that international financing for nutrition-specific investment is out of proportion to the level of need to meaningfully and significantly improve nutrition for longer-term benefits including individual well-being and economic and social progress. Spending must be considered against what is needed at the national level to better assess if the allocation of financing is proportionate to this need and who the funds are reaching. Unless needs and financing are brought together and investments better targeted, we will continue to leave people behind. In the future, the Global Nutrition Report plans to provide analysis that looks at trends in allocation by recipient country and need.[28]
In the context of these financing gaps, the Power of Nutrition presents an interesting example of how new ways of innovative financing can leverage multiple partners and scale up financing for nutrition (Spotlight 5.4).
Tracking donor financing for nutrition-sensitive investments
As noted in Spotlight 5.3, the OECD DAC donor reporting system does not enable donors to report their nutrition-sensitive investments. In this context, the Global Nutrition Report uses self-reported data by donors as part of the Nutrition for Growth (N4G) process to get a better picture of aid to nutrition-sensitive activities.
Self-reporting has limitations and methodologies for identifying relevant spending differ between reporting donors. The SUN Donor Network methodology goes some way in corroborating a consensual approach to identifying donor spending on nutrition-sensitive interventions, but it is not adopted or applied consistently across all reporting donors, meaning the resulting spending figures cannot be compared. Adopting the new OECD DAC policy marker is an important opportunity to standardise financial reporting against nutrition commitments and ensure the data is comparable and therefore meaningful. The policy marker, like the SUN methodology, is subject to human error and limited by the quality and detail of donors’ project documentation. The notes accompanying Table 5.1 show some of these differences and inconsistencies.
While tracking these investments is important, unlike nutrition-specific interventions, there is less information about required financing and costs of nutrition. Though many countries have nutrition investment frameworks, more attention needs to be given to costing exercises to have realistic assessments of nutrition-specific financing needs. Without good costings, it is difficult to identify gaps, prioritise investments and monitor progress.
Each donor has its own approach and priorities that guide its allocations. Spotlights 5.5, 5.6 and 5.7 provide more details on the US, the European Commission and International Fund for Agricultural Development (IFAD)’s investments and commitments in nutrition-sensitive approaches to their work.
Table 5.1 shows the US has been by far the biggest donor for nutrition-sensitive approaches over the last few years, with the EU, Canada and the UK also significant contributors. In 2016, nutrition-sensitive spending totalled US$6.08 million, up from US$5.48 million in 2015.
Innovative financing for nutrition: The Power of Nutrition
Mavis Owusu-Gyamfi and Tatum Summers
The scale of global undernutrition is matched by the huge gap in financing needed to tackle it. To address this gap, The Power of Nutrition was established in 2015 by the UK Department for International Development, the Children’s Investment Fund Foundation, the UBS Optimus Foundation, UNICEF and the World Bank. This platform mobilises funding for nutrition-specific interventions for undernutrition by leveraging financing and partnerships between the private sector, governments, donors and implementing partners to scale up sustainable national nutrition programmes. This model sees every dollar invested in The Power of Nutrition doubled by the platform, and then doubled again by the programme implementing partner, thus quadrupling the original funding. It is already making a difference in six countries across sub-Saharan Africa and aims to unlock US$1 billion of new financing for nutrition programmes by 2022.
Scaling up nutrition funding in Côte d’Ivoire
The funding model was used to good effect in Côte d’Ivoire, where The Power of Nutrition facilitated a partnership to support the government’s Multisectoral Nutrition and Child Development Project (MNCDP). The partnership involved Transforming Education in Cocoa Communities (TRECC) – a private sector consortium established to improve the living conditions of children and young people through better education, including parenting and early childhood training – the Bill & Melinda Gates Foundation and the World Bank.
As a key investor in Côte d’Ivoire, TRECC was asked if it would consider co-investing with The Power of Nutrition and the World Bank in the MNCDP. TRECC expressed an interest in investing US$5 million, providing the other partners (World Bank, the government and The Power of Nutrition platform funders) expanded the programme coverage to some cocoa-producing regions and the content to include parenting education and child stimulation. Following extensive negotiations, the partners agreed to expand the programme coverage and pilot a parenting-and-child-stimulation approach which if successful would be scaled up.
At the same time, The Power of Nutrition was in discussion with the Gates Foundation about supporting national programmes in three African countries. A request for Côte d’Ivoire to be included in the final list of countries was approved by the Gates Foundation, which enabled The Power of Nutrition to increase its overall commitment to MNCDP by another US$1 million.
The Power of Nutrition, along with its donors, invested US$10.4 million in total, which was matched by US$50 million from the International Development Association (a loan from the World Bank to the government of Côte d’Ivoire), bringing the total programme size to US$60.4 million over five years – 10 times more than the original US$6 million invested by TRECC and the Gates Foundation.
This programme brought together a group of diverse allies to collaborate and finance a single nutrition programme in Cote d’Ivoire through The Power of Nutrition platform. Furthermore, it secured funding from donors who had historically not funded nutrition. And Côte d’Ivoire now has its first national large-scale programme focused on improving nutrition and child development in the early years.
The Power of Nutrition aims to establish a portfolio of nutrition programmes cross sub-Saharan Africa and Asia that will enable an additional 17 million children and 18 million women to access nutrition services, help avoid 600,000 cases of stunting and 1.5 million cases of maternal anaemia, and prevent 60,000 deaths of children under five years of age.[29] To date, The Power of Nutrition has raised US$58 million from the likes of TRECC, the Gates Foundation and others. This has been doubled by platform funders such as the UK Department for International Development and the Children’s Investment Fund Foundation, which have committed just over US$150 million to date. The leverage model has contributed to a total of US$360 million worth of programming in sub-Saharan Africa. The first two programmes are enabling over 8 million children and over 3 million women to access nutrition services to date.
Scale, systemic reform and sustainability
The Power of Nutrition has a responsibility to ensure that its leveraged financing is as effective as possible, and conducts due diligence on all implementing partners. Results are monitored and evaluated to shape future programmes. It seeks to multiply impact on the ground to ensure that collective financial commitments are as effective as possible, by focusing on three S’s:
- Scale: Invests in countries where the stunting prevalence is more than 30% and more than 250,000 children are stunted. To ensure that programmes deliver results at scale, the minimum budget is US$10 million.
- Systemic reform: Supports governments to build their capacity and systems to support the implementation of national nutrition programmes. For example, in Liberia, part of the programme with UNICEF funds a person dedicated to leading the roll out of new nutrition information systems.
- Sustainability: Seeks long-term gains which carry on even after a programme has finished. The programme with the World Bank in Tanzania supports the government to deliver nutrition services through the national health system by using its own resources. Payments are only made when the government achieves certain targets.
TABLE 5.1 Nutrition disbursements reported to the 2014–2018 Global Nutrition Reports, for 2010–2016
Nutrition specific
| REPORTED AS US$ THOUSANDS | 2010 | 2012 | 2013 | 2014 | 2015 | 2016 |
|---|---|---|---|---|---|---|
| Australia+++ | 6,672 | 16,516 | NR | 20,857 | NA | 15,639 |
| Canada* | 98,846 | 205,463 | 169,350 | 159,300 | 108,600 | 97,628 |
| EU** | 50,889 | 8 | 54,352 | 44,680 | 48,270 | 29,721 |
| France*** | 2,895 | 3,852 | 2,606 | 6,005 | 4,660 | 8,572 |
| Germany | 2,987 | 2,719 | 35,666 | 50,572 | 51,399 | 18,047 |
| Ireland | 7,691 | 7,565 | 10,776 | 19,154 | 13,079 | 12,391 |
| Netherlands | 2,661 | 4,007 | 20,216 | 25,025 | 31,604 | 46,331 |
| Switzerland§ | 0 | 0 | 0 | 0 | 0 | 0 |
| UK**** | 39,860 | 63,127 | 105,000 | 87,000 | 92,400 | 156,000 |
| US+ | 82,613 | 229,353 | 288,649 | 263,241 | 382,891 | 296,974 |
| Gates Foundation | 50,060 | 80,610 | 83,534 | 61,700 | 96,500 | 96,616 |
| CIFF | 980 | 5,481 | 37,482 | 26,750 | 53,607 | 32,784 |
| World Bank++ | NA | NA | NA | NA | NA | NA |
| 13 donors total | 346,154 | 618,701 | 807,631 | 764,284 | 878,350 | 810,703 |
Nutrition sensitive
| REPORTED AS US$ THOUSANDS | 2010 | 2012 | 2013 | 2014 | 2015 | 2016 |
|---|---|---|---|---|---|---|
| Australia+++ | 49,903 | 114,553 | NR | 87,598 | NA | 128,706 |
| Canada* | 80,179 | 90,171 | NR | 998,674 | 1,271,986 | 1,309,732 |
| EU** | 392,563 | 309,209 | 315,419 | 570,890 | 423,704 | 496,672 |
| France | 23,003 | 27,141 | 33,599 | NR | 23,781 | 16,446 |
| Germany | 18,856 | 29,139 | 20,642 | 51,547 | 84,174 | 186,780 |
| Ireland | 34,806 | 45,412 | 48,326 | 56,154 | 54,217 | 54,248 |
| Netherlands | 2,484 | 20,160 | 21,616 | 18,274 | 28,422 | 56,510 |
| Switzerland | 21,099 | 28,800 | 29,160 | 26,501 | 43,656 | 42,190 |
| UK**** | 302,215 | 412,737 | 734,700 | 780,500 | 928,300 | 693,000 |
| US+ | 2,005,880 | 1,968,759 | 2,449,706 | 2,656,269 | 2,555,332 | 3,011,605 |
| Gates Foundation | 12,320 | 34,860 | 43,500 | 29,200 | 42,000 | 62,619 |
| CIFF | 0 | 0 | 854 | 154 | 20,725 | 21,595 |
| World Bank++ | NA | NA | NA | NA | NA | NA |
| 13 donors total | 2,943,308 | 3,080,941 | 3,697,522 | 5,275,761 | 5,476,297 | 6,080,103 |
Total
| REPORTED AS US$ THOUSANDS | 2010 | 2012 | 2013 | 2014 | 2015 | 2016 |
|---|---|---|---|---|---|---|
| Australia+++ | 56,575 | 131,069 | NR | 108,455 | NA | 144,345 |
| Canada* | 179,025 | 295,634 | NA | 1,157,974 | 1,380,586 | 1,407,360 |
| EU** | 443,452 | 309,217 | 369,771 | 615,570 | 471,974 | 526,393 |
| France | 25,898 | 30,993 | 36,205 | NA | 28,441 | 25,018 |
| Germany | 21,843 | 31,858 | 56,308 | 102,119 | 135,573 | 204,827 |
| Ireland | 42,497 | 52,977 | 59,102 | 75,308 | 67,295 | 66,640 |
| Netherlands | 5,145 | 24,167 | 41,832 | 43,299 | 60,027 | 102,841 |
| Switzerland | 21,099 | 28,800 | 29,160 | 26,501 | 43,656 | 42,190 |
| UK**** | 342,075 | 475,864 | 839,700 | 867,500 | 1,020,700 | 849,000 |
| US+ | 2,088,493 | 2,198,112 | 2,738,356 | 2,919,510 | 2,938,223 | 3,308,578 |
| Gates Foundation | 62,380 | 115,470 | 127,034 | 90,900 | 138,500 | 159,235 |
| CIFF | 980 | 5,481 | 38,336 | 26,904 | 74,332 | 54,379 |
| World Bank++ | NA | NA | NA | NA | NA | NA |
| 13 donors total | 3,289,462 | 3,699,642 | 4,335,804 | 6,034,040 | 6,359,307 | 6,890,806 |
Source: Authors, based on data provided by the donors. Notes: Data is in current prices. Most donors report in US$, and where they do not, an annual average market exchange rate from OECD or the US Internal Revenue Service was used. CIFF: Children’s Investment Fund Foundation; Gates Foundation: Bill & Melinda Gates Foundation; NR: no response to our request for data; NA: not applicable (meaningful totals cannot be calculated owing to missing data or data produced using a methodology other than the SUN Donor Network’s). Calculations and reporting often differ by country and donor, as shown by symbols (*+§) and explained in note 30.[30]
Steps forward in US government financing of nutrition
Erin Milner, Anne Peniston, Kate Consavage, Katherine Owens and Amy Fowler
Introduction
The US government, through the US Agency for International Development (USAID), has made substantial commitments to improve nutrition through maternal and child health, emergency and food assistance, and agriculture and food security programming. The US Government Global Nutrition Coordination Plan (2016–2021) was developed to strengthen the impact of the diverse nutrition investments across the US government, maximising support to country-led programmes and catalysing progress toward World Health Assembly nutrition targets. Through the Global Food Security Strategy (2017–2021), the US government is elevating nutrition in food security and agriculture activities. The programming, impacts and lessons learned from the use of US government funds are described here to show how the US government is improving nutrition.
Funding and programming
Internal tracking of US government spending shows that while nutrition-specific investments have decreased, total commitments to nutrition have increased annually since 2013, up from US$2.7 billion to US$3.31 billion in 2016, with increasing amounts going towards nutrition-sensitive programming (Table 5.1). USAID supports the largest number of global nutrition programmes funded by the US government, which account for the greatest proportion of total nutrition spending.
USAID programming targets the direct and underlying causes of malnutrition, emphasising the critical 1,000 days window, and focuses on linking humanitarian assistance with development programming to build vulnerable communities’ resilience to shocks. USAID’s strategic goals for improving nutrition globally centre on the agency’s Multi-Sectoral Nutrition Strategy (2014–2025) through interventions that include providing quality services, building capacity, strengthening multisector coordination and enhancing global leadership for nutrition. Programmes, including capacity building and national policy development, emphasise the importance of engaging a variety of sectors such as health, agriculture, livelihoods, WASH, education, family planning and early childhood development to improve nutrition outcomes. USAID multisectoral nutrition activities are funded in 28 countries globally, including 18 in Africa, 7 in Asia, and 3 in Latin America and the Caribbean. Examples of the type of investments made are well illustrated by Nepal and Malawi.
- In Nepal, USAID funds cross-cutting and contextualised community, facility and national nutrition efforts. USAID’s integrated nutrition programme, Suaahara II (Good Nutrition), works in 42 of Nepal’s 77 districts to improve the nutritional status of pregnant and lactating women, and children. In 2017, this innovative programme reached 1.6 million children under five and their caregivers with support for essential nutrition and hygiene actions, including breastfeeding and infant and young child feeding education and other services to prevent and manage acute malnutrition. Suaahara II nutrition activities are integrated with health, WASH, family planning and agriculture activities. Through these actions, exclusive breastfeeding in target districts increased from 46% in 2012 to 70% in 2016, and the national prevalence of children 6 to 23 months receiving a minimum acceptable diet increased by 11%.
- In Malawi, over 2.9 million children under five years were reached in 2017 with USAID-funded nutrition-specific interventions. USAID has supported the Ministry of Health to provide vitamin A supplementation and deworming; hospitals to achieve ‘baby friendly’ status as part of the Baby Friendly Hospital Initiative; agriculture extension services to strengthen production of nutritious foods; and nutrition programmes to target HIV-affected populations. USAID also developed and implemented a nutrition training curriculum for nurses and midwives as well as a dietetics programme to build Malawi’s nutrition technical capacity, reaching over 100,000 people with nutrition-related professional training in 2017.
Impact
In USAID’s 20 priority countries for maternal and child nutrition, the prevalence of aggregated national-level stunting and maternal anaemia have decreased and exclusive breastfeeding rates have increased since 2009. In 2016, over 27 million children under five years were reached by nutrition-specific interventions through US government-supported programmes. In 2016, USAID reached over 950,000 pregnant women with nutrition interventions and over 3 million women received exclusive breastfeeding education. USAID funding also builds capacity and country ownership of nutrition policies and programmes, reaching over 1 million people with nutrition-related professional training in 2016.
Lessons learned
Since the start of USAID’s nutrition programming nearly 60 years ago, USAID has continually adapted activities to reflect project learning, changing country contexts and emerging evidence, but challenges remain. Coordinating nutrition programming across multiple sectors is difficult, yet USAID is continually monitoring and learning from country programmes and using this information to adapt activities for greater multisectoral nutrition collaboration. USAID is committed to supporting countries on their journeys to self-reliance, which requires countries to increase their commitment and capacity to address their own development needs. Strengthened country-level governance and accountability are needed to sustain a coordinated, multisectoral enabling environment for successful nutrition programming.
The European Commission’s investment in nutrition
Madeleine Onclin
At the 2013 N4G summit, the European Commission made a pledge to allocate €3.5 billion for nutrition between 2014 and 2020. This bold commitment was in line with its 2013 nutrition policy framework for addressing undernutrition. Nearly all the money – €3.1 billion euros – was for nutrition-sensitive programmes on the basis that it would have more widespread impact by addressing the underlying causes of the problem. To operationalise that commitment, DEVCO (the Commission’s International Development and Cooperation Directorate) developed its Action Plan on Nutrition with the goal of supporting partner countries in reducing the number of stunted children by 7 million by 2025. The funding helped support a range of innovative programmes to reduce stunting such as:
- A nutrition-sensitive project run by CARE to strengthen gender equality and empower women in Ethiopia. This project enables people and communities to explore, challenge and change gender inequality. Early signs are encouraging: more girls and young women are starting to earn an income and save money; they are better informed about sexual and reproductive health; and gender-based violence has markedly reduced.
- A Livelihoods and Food Security Trust Fund in Myanmar. This multi-donor initiative has nutrition as one of its strategic objectives. Since 2014, mothers and children in three areas have received cash to buy nutritious food and access health services. At the same time, pregnant women and mothers have increased awareness of how they can improve family diets. Taken together, the benefits are clear – mothers receiving both cash and training had fewer low birth weight babies, exclusive breastfeeding rates have doubled, and stunting rates are down by five percentage points.
- The Agri-Connect project in Tanzania went live in early 2018 to create more wealth from farming by linking smallholder farmers to value chains and markets. At the same time, it aims for improved food and nutrition security by supporting selected communities to access and use food better. It is hoped that tea, coffee and flower-farming communities will earn more money as well as enjoy improved nutrition by growing a wider range of food.
Initially, accountability for the Commission’s N4G funding commitment was seen as a challenge,because at that time there was no agreed way to track nutrition-sensitive funding. In response, the EU worked with the SUN Donor Network to define a common approach to track and report nutrition allocations. For even greater transparency, the Commission decided to publish annual progress reports detailing and analysing how funding has been allocated and disbursed.
These progress reports have in turn informed the Commission’s various funding decisions. The findings were revealing and served as a reality check. For example, the first progress report showed the Commission’s nutrition spending, as a proportion of its total funding from 2010 to 2014, was two to three times greater than the average spending on nutrition by donors as a proportion of their ODA in 2012.
By the time the first progress report was published, a strategy was already in place to ensure the Commission had high-quality technical support and nutrition advice to strengthen its policies and programmes, at country, regional and global levels. The results were confirmed via N4G tracking in the 2017 Global Nutrition Report, indicating significant progress. The Commission’s forthcoming third progress report will present the most recent analysis, showing that nearly 90% of the €2.5 billion allocated so far has been for nutrition-sensitive projects. Its investment is on course to meet the €3.5 billion pledge commitment by 2020.
International Fund for Agricultural Development (IFAD)’s approach to investing in nutrition-sensitive agriculture
Juliane Friedrich
Progress on the N4G commitments
“Improving the nutritional level of the poorest population in developing countries” is a principal objective of the agreement establishing IFAD. Improving nutrition through better and nutrition-sensitive food production systems is thus at the heart of IFAD’s work.
As part of the N4G commitment, in 2013 IFAD committed to ensuring that 20% of all new IFAD projects and 30% of all new IFAD country strategic opportunities programmes (COSOPs) are nutrition sensitive. A nutrition-sensitive project is defined as one that integrates nutrition-relevant objectives, indicators and activities into the project design and its implementation. A nutrition-sensitive COSOP includes a nutrition assessment, describing the nutrition situation in the country and how the strategic objectives of the programme relate to improving nutrition.
After three years, the 2016–2018 IFAD strategy is increasing its commitment. Now, 33% of projects and100% of COSOPs must be nutrition sensitive. In 2019–2021, 50% of projects and 100% of COSOPs must be nutrition sensitive. As of 2017, 47% of new projects and 100% of COSOPs were nutrition sensitive.
Nutrition is also now firmly embedded in IFAD’s corporate strategies and commitments. Aside from its central role in IFAD’s Strategic Framework, nutrition has also been integrated into IFAD’s Results Management Framework and Commitment Matrix and has become increasingly featured in the Report on IFAD’s Development Effectiveness. Increased corporate attention also led to selecting nutrition as one theme in the 2017 Portfolio Stocktake.
The key to success
Supplementary funds from the governments of Canada and Germany have played an essential role in achieving the objectives of the Nutrition Action Plan (2016–2019) and transforming how nutrition is perceived and taken up in IFAD. The government of Germany also funded cutting-edge research to develop evidence-based guidance for the design of nutrition-sensitive value chain projects, which will allow for leveraging the potential of value chains (one of IFAD’s key areas of investment) for nutrition. IFAD has mobilised unrestricted complementary contributions for nutrition from the governments of Russia and Luxembourg. These facilitated the capacity development needed to understand and uptake nutrition at the IFAD headquarters and in country offices.
Key challenges
A major challenge for mainstreaming nutrition in IFAD was the perception that increased agricultural production and income automatically translate into better nutrition. Adding nutrition expertise into design missions, conducting sensitisation sessions across the regional and thematic divisions at headquarters level but also in the field, and integrating nutrition in the IFAD portfolio review fostered a better understanding of nutrition, food systems and healthy diets. Meanwhile, nutrition mainstreaming has gained a lot of support from staff including regional directors, country programme managers, in-country officers and technical experts from other fields. Still, it continues to be challenging due to limited understanding on how to integrate and implement nutrition-sensitive activities in IFAD investments and grants.
Advancing progress in nutrition
To continue meaningful nutrition integration into IFAD’s work, it must further develop capacity and competence in nutrition at all levels, particularly country level. IFAD’s decentralisation strategy is instrumental. Having technical expertise at country level will allow IFAD to identify and develop in-country competencies in nutrition-sensitive agriculture.
Nutrition is now part of the key portfolios of IFAD’s work, which includes environment, climate, gender and social inclusion, youth and indigenous people. This leads the way to a holistic and horizontal integration of cross-cutting themes with nutrition essential for rural transformation.
Tracking donor financing for obesity and non-communicable diseases
Until 2018 it has not been possible for donors to report their ODA to obesity and diet-related NCDs. The Global Nutrition Report therefore developed its own methodology to track spending and has reported results for the last three years. Our analysis shows very low levels of spending. In 2016 – the most recent year available – just 0.018% of ODA was allocated to obesity and diet-related NCDs. Disbursements increased in 2016 – from US$25.3 million to US$32.5 million but were still lower than in 2014 (Figure 5.8). Commitments for future spending were at their highest level for three years – albeit at just US$51.2 million.
Donors investing the most in diet-related NCDs include Australia, which has contributed US$8.7 million – more than a quarter of global spending. The other large donors include the EU, the UK, Switzerland, Canada, Italy and New Zealand (Figure 5.9).
Looking at where the money was spent, just over half went to upper-middle-income countries, 20% to lower-middle-income countries and less than 3% to the low-income countries. This breakdown can be misleading, however, as nearly a quarter of the total was allocated regionally or with no single specified recipient. Tonga and Fiji – both countries with high levels of diabetes – were the largest recipients of ODA for tackling diet-related NCDs, followed by Lebanon and Nauru.
FIGURE 5.8 Diet-related NCD ODA disbursements and commitments, 2014–2016
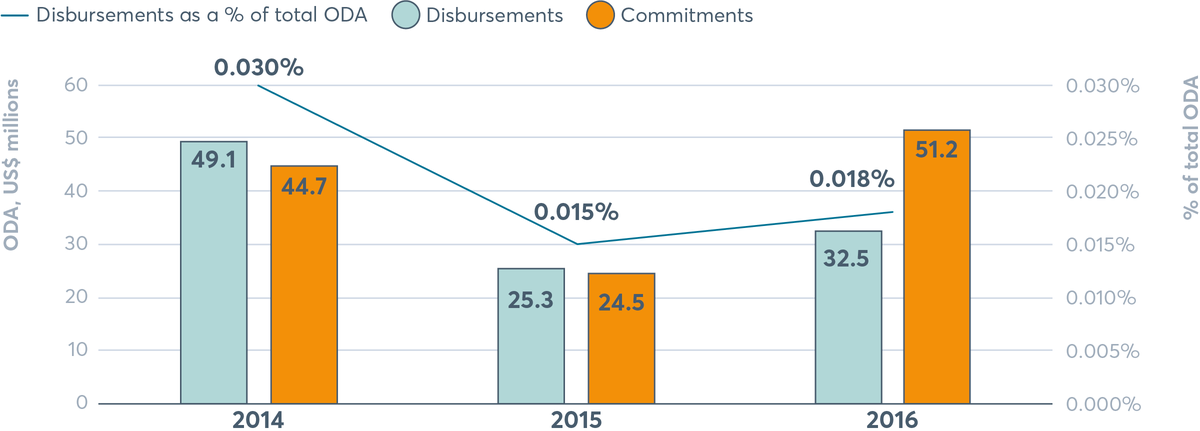
Both diet-related NCD ODA disbursements and commitments decreased from 2014 to 2015, and then increased to 2016. As a percentage. Disbursements were US$49.1 million in 2014, US$25.3 in 2015 and US$32.5 in 2016. As a percentage of total ODA, disbursements decreased from 0.030% in 2014 to 0.015% in 2015, and then increased slightly to 0.018% in 2016. Commitments were US$44.7 million in 2014, US$24.5 million in 2015 and US$51.2 million in 2016.
Source: Development Initiatives, based on OECD DAC Creditor Reporting System. Notes: Amounts are based on gross ODA disbursements current prices. Data downloaded on 2 May 2018.
FIGURE 5.9 Diet-related NCD ODA disbursements 2016, by donor
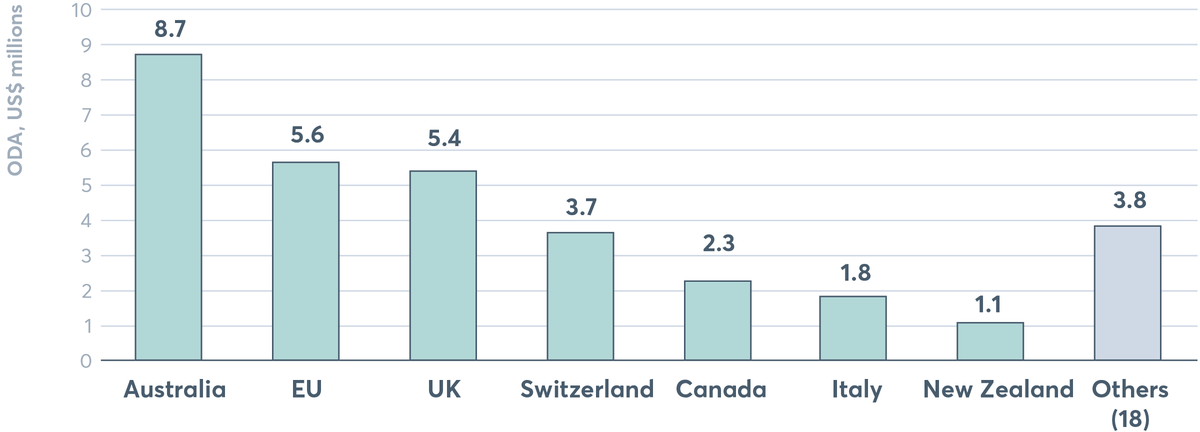
Australia was the largest donor of diet-related NCD ODA disbursements in 2016 with US$8.7 million. This is followed by the EU with US$5.6 million, the UK with US$5.4 million, Switzerland with US$3.7 million, Canada with US$2.3 million, Italy with US$1.8 million and New Zealand with US$1.1 million.
Source: Development Initiatives, based on OECD DAC Creditor Reporting System. Notes: Amounts are based on gross disbursements in 2016. Others comprise: Austria, Belgium, Czech Republic, Denmark, Finland, France, Germany, Inter-American Development Bank Special Fund, Ireland, Japan, Korea, Luxembourg, Norway, Poland, Spain, Sweden, United Arab Emirates and the US. Data downloaded on 2 May 2018.
As Spotlight 5.3 shows, advancements have been made to improve future tracking of nutrition by aid donors with the adoption of a new purpose code and policy marker. These will only bear fruit if the code and policy marker are successfully adopted by all donors and consistently used to track their spending. The next step is to ensure guidelines are established to help donors implement the code and policy marker. This initiative has been taken up by the SUN Donor Network.
Progress has also been made to improve tracking of donor investments in healthy eating and obesity actions as part of a set of five new codes on NCDs.[31] Unlike HIV and AIDS, tuberculosis, malaria, reproductive health and undernutrition, there has been no purpose code for donors to report spending on NCDs, making it very challenging to track aid expenditure. Analysis was even more difficult because of the way health ODA was categorised. As a result, it has been difficult to verify donors’ expenditure reports, including claims that NCDs were being funded under the category of ‘strengthening health systems’. A major step forward was made in 2018 when NCD tracking codes were adopted, including one on programmes and interventions that promote healthy diets through reduced consumption of salt, sugar and fats and increased consumption of fruits and vegetables (Spotlight 5.8).
A new harmonised and transparent reporting system for monitoring of financial flows for non-communicable diseases
Katie Dain
The political commitment to tackling NCDs has yet to translate into adequate funding. We see it nationally, where nowhere-near-enough money is allocated from domestic budgets; bilaterally, where a miserly 2.6% of development aid for health goes to NCDs; and globally, with NCDs the poor relation to other health priorities. The picture is even gloomier for diet-related NCDs such as obesity. As discussed earlier, a minuscule 0.018% of global development aid was spent on diet-related NCDs in 2016, though poor diets are estimated to be the second leading cause of ill health.
The urgent need for more and better data on NCD financing became clear some years ago. Domestic data is almost non-existent, partly because NCDs tend not to appear in national health accounts, and partly because it is difficult to track spending across all governments departments. Important lessons could be learned from climate public expenditure and institutional reviews which provide valuable analysis of cross-departmental spending and investments.[32]
Tracking and reporting NCDs in ODA for health has been grossly inadequate. Bilateral and multilateral aid agencies are committed to accurate accounting of their ODA flows through the OECD DAC CRS. But, unlike HIV and AIDS, tuberculosis, malaria, reproductive health and undernutrition, there has been no purpose code for NCDs in the CRS, making it very challenging to track aid expenditure on them. Analysis was made even more difficult because of the way health ODA is categorised. As a result, it was nearly impossible to verify donors’ expenditure reports, including claims that NCDs were being funded under the category of ‘strengthening health systems’.
Faced with this mess, the NCD Alliance and others have long been calling for the current CRS to include a purpose code for NCDs. Governments committed to this at the UN High-Level Review on NCDs in 2014, inviting the OECD DAC “to consider developing a purpose code for NCDs in order to improve the tracking of official development assistance in support of national efforts for the prevention and control of NCDs.” Two years later the OECD started work on a proposal, coinciding with a review of the CRS aimed at better aligning the purpose codes and policy markers with the SDGs.
In June 2017, five new codes on NCDs were agreed, along with adjustments to other codes to reflect NCDs. These are designed to align closely with the SDG targets – tobacco control (SDG 3.a), control of harmful use of alcohol and drugs (SDG 3.5), promotion of mental health and well-being (SDG 3.4), research for NCD prevention and control (SDG 3.b), and other prevention and treatment of NCDs (SDG 3.4). This last code includes “programmes and interventions that promote healthy diet through reduced consumption of salt, sugar and fats and increased consumption of fruits and vegetables” and gives examples such as food taxes, nutrition education and promoting healthy eating in schools, workplaces and communities.
The new codes come into effect in 2019, with reporting on 2018 financial flows. They are a big step forward in helping us track funding for improved eating habits, and they will significantly help us analyse financial flows, trends and accountability for NCDs.
Financial commitments
A major achievement in international financing has been made in the collective commitment by donors at the N4G Summit in 2013: 10 signatories that report their spending to the Global Nutrition Report pledged a collective US$19.6 billion by 2020. The same 10 donors (US, EU, UK, the Bill & Melinda Gates Foundation, Children’s Investment Fund Foundation, World Bank, Netherlands, Ireland, Germany and Australia) have cumulatively disbursed US$21.8 billion (2013–2016) ahead of 2020.
2017 saw additional forward steps in commitments to financing. The Global Nutrition Summit in Milan brought together three of the largest original donors combined with four new ones to pledge an additional US$640 million to be disbursed along with other commitments (both financial and non-financial) from countries, businesses and civil society organisations.
Nutrition for Growth commitments
Commitments can take many forms – not just financial. On the day of the closing ceremony of the 2012 Olympic Games in London, UK Prime Minister David Cameron and Brazil’s Vice President Michel Temer called for a major push to end hunger and improve the nutrition of children and mothers in the critical first 1,000 days window between pregnancy and age two. This political impetus led to N4G, a movement to harness and build on the various efforts aimed at combating malnutrition and turn them into financial, but also policy and programmatic, commitments.[33]
At the N4G Summit, countries made four types of commitments:
- ‘Impact commitments’ on improving nutritional status
- ‘Financial commitments’ on the sources and amounts of funding to nutrition
- ‘Policy commitments’ on policies to create a more enabling environment for nutrition action
- ‘Programme commitments’ on programmes to improve nutritional status.
This year’s report documents progress between 2017 and 2018 on all types of categories of those original N4G commitments. Three independent reviewers assessed progress against the original 2013 commitments before a consensus was reached, rating them ‘reached’, ‘on course’, ‘off course’ or ‘not clear’. We also highlight three examples of financial commitments, which are on track or achieved and provide examples of what they have funded and the difference they have made.
Figure 5.10 shows the progress in meeting the commitments made at the N4G summit in 2013. In 2018, only 36% of signatories were assessed as having either met their commitment or being on course to meet their commitments by 2020. Given the low response rates (45% of all signatories), it is unclear whether this is indicative of true progress on commitment delivery, or merely a result of limited responses. As a continued trend, business stakeholders had the lowest response rate in 2018. From the response rate, it is clear that the ‘staying power’ of reporting on progress on the N4G process has waned. In previous Global Nutrition Reports, we have analysed why this is, and we continue to be optimistic that there are some commitment endeavours that have staying power and others that do not based on how they are structured along with their long-term intent.
FIGURE 5.10 Overall tracking of N4G commitments, 2014–2018
Overall tracking of N4G commitments, 2014–2018
For source and notes, see Figure 5.11
FIGURE 5.11 Tracking progress against N4G commitments by signatory group, 2018
Tracking progress against N4G commitments by signatory group, 2018
Source: Authors. Notes: In 2013, 205 commitments were made, but the 2014 Global Nutrition Report included only 173 because businesses were not ready to report on all their commitments. There were 174 commitments in 2015 and 173 in 2014 because Ethiopia did not separate its N4G commitment into programme and policy components in its 2014 reporting, but did so in 2015. The total since 2016 (204) includes all commitments made; this differs from the total made in 2013 because the Naandi Foundation was taken out of the reporting process. CSO: civil society organisation; N4G: Nutrition for Growth.
Among stakeholders that responded, national governments seem to encounter the greatest challenges with meeting their commitments. Although all responding countries reported meeting their policy commitments, about half of the impact, financial and programmatic commitments with data were found to be off-track (Figure 5.11). A mere 13% of countries reported being on course or reaching their financial commitment targets. These results indicate the need for firstly, well-thought-out, realistic and measurable commitments in the form of a strong national nutrition plan. This must be followed with substantial efforts to translate national nutrition plans into action by increasing commitment and improving accountability systems, support and information sharing in the nutrition community around nutrition policies and programmes that aim to reduce the burden of malnutrition. More details on progress against these commitments by each N4G stakeholder can be found on the Global Nutrition Report website.
It is essential that reporting against these commitments is increased as we approach the deadline for achieving them in 2020. Clearly, the current methods to report against the commitments are not sustaining momentum. Before more commitments are made in 2020, there is an urgent need for better mechanisms to achieve and track accountability to be developed. These need to be pioneered by the nutrition community so they suit their needs and ensure accountability across all actors.
New commitments and looking ahead to Tokyo 2020
The N4G 2013 commitments were originally made for an eight-year timeframe (2013–2020). Since then, several global agreements such as the Rome Declaration on Nutrition made at the Second International Conference on Nutrition in 2014, the SDGs in 2015 and the UN Decade of Action on Nutrition 2016–2025 have provided opportunities for new and different commitments. The High-Level Meeting on NCDs in September 2018 welcomed 23 heads of government and state and 55 ministers of health, who made 13 new commitments on NCDs.[34]
For example, the Rome Declaration adopted 10 commitments; the International Conference on Nutrition accompanying Framework for Action includes 60 policy recommendations, and the UN Decade of Action on Nutrition provides a concrete timeframe to realise these commitments and ramp up global action on quality nutrition.[35] The Nutrition Decade calls on governments to set and achieve SMART[36]objectives in six areas: sustainable, resilient food systems for healthy diets; aligned health systems providing universal coverage of essential nutrition actions; social protection and nutrition education; trade and investment for improved nutrition; safe and supportive environments for nutrition at all ages; and strengthened governance and accountability.
Several countries have made commitments under the Nutrition Decade umbrella.[37] Brazil and Ecuador were the first to commit more domestic funding, followed among others by Côte d’Ivoire, El Salvador, India, Italy, Madagascar, Niger, Nigeria and Zambia. Others, including Panama, Portugal and Thailand, are targeting eliminating trans fats. The 60 SUN countries are making their existing commitments SMART in the fight against malnutrition in all its forms including overweight, obesity and NCDs. Norway is leading a Global Action Network on Sustainable Food from the Oceans and Inland Waters for Food Security and Nutrition, while Chile helms the Action Network for the Americas on Healthy Food Environments and Fiji hosts the Action Network for Ending Childhood Obesity in the Pacific. Brazil is committed to five action networks ranging from salt reduction to sustainable school meals. France and Australia are joining efforts to lead a global action network on nutrition labelling.
The Global Nutrition Report has called for SMART commitments to enable accountability. Using a similar approach to the 2015 Global Nutrition Report, the new Milan commitments were assessed on their ‘SMART-ness’, with a focus on specific, measurable and timebound. Independent reviewers rated two of the three commitments to be SMART. Measurability was the most common missing element, with none of the Milan commitments indicating how progress will be measured (Figure 5.12).
The N4G Summit in Tokyo in 2020 offers the next exciting opportunity for countries, donors and other organisations to pledge new and SMART commitments, as well as accelerate progress on delivering existing commitments. Japan announced it would host the N4G Summit in 2020 in Tokyo to accelerate the nutrition improvement of the people around the world as the basis of their good health and welfare.
The summit intends to galvanise momentum on improving nutrition and mainstream the relevant policies. It is an important milestone for all stakeholders and people who are malnourished. It has the potential to set a new vision beyond 2020 to tackle malnutrition in all its forms, reinvigorate and motivate action as well as provide hope for those people living with the impacts of malnutrition.
FIGURE 5.12 Percentage of 2017 Milan commitments that met SMART criteria and were rated as SMART overall (N=38)
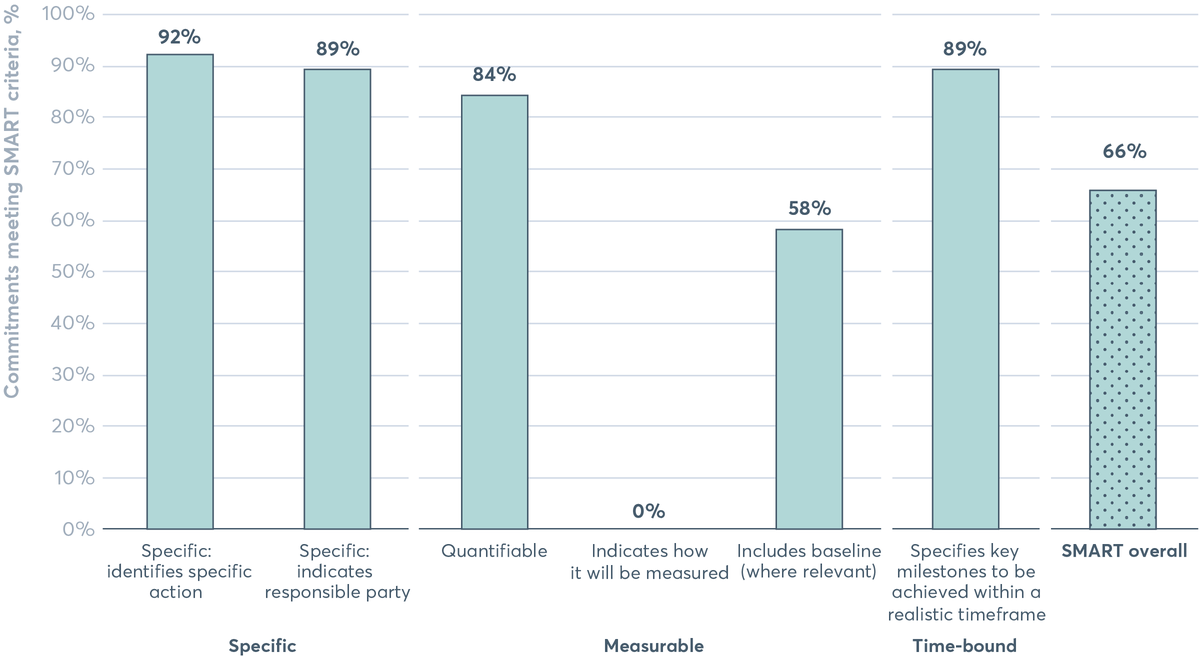
66% of the 2017 Milan Commitments are as SMART (specific, measurable and time-bound) overall.
Source: N4G Annex of Commitments.[38]
[The following footnote relates to the chart above] [38]
Photo: © UN Women/Narendra Shrestha
Share The fight against malnutrition – commitments and financing
Downloads
- English Chapter 5 2018 Global Nutrition Report (PDF 5.7MB) 2018 Global Nutrition Report Launch slide deck (PPTX 4.5MB) 2018 Global Nutrition Report Launch slide deck (PDF 1.2MB) 2018 Global Nutrition Report London launch slide deck (PDF 1.0MB) 2018 Global Nutrition Report London launch slide deck (PPTX 4.6MB)
- French Chapitre_5_2018_Rapport_sur_la_Mondiale (PDF 4.0MB) 2018 Global Nutrition Report (PDF 15.7MB)
- Spanish Capítulo_5_2018 Informe de la Nutricion Mundial.pdf (PDF 4.0MB) 2018 Global Nutrition Report (PDF 10.2MB)
Data downloads
Download the 2018 Global Nutrition Report
Download the reportFootnotes
-
Return to source text
Shekar M., Kakietek J., Dayton E.J. and Walters D., 2017. An Investment Framework for Nutrition: Reaching
the Global Targets for Stunting, Anemia, Breastfeeding, and Wasting. Directions in Development–Human Development. World Bank. Available at: https://openknowledge.worldbank.org/handle/10986/26069
-
Return to source text
Save the Children, 2018. Nutrition Boost. Available at: www.savethechildren.org.uk/content/dam/gb/reports/health/nutrition-boost.pdf
-
Return to source text
WHO, 2018. Investing in noncommunicable disease control generates major financial and health gains (news release). 16 May 2018. Available at: www.who.int/news-room/detail/16-05-2018-investing-in-noncommunicabledisease-control-generates-major-financial-and-health-gains
-
Return to source text
WHO, 2018. WHO Global dialogue on financing for prevention and control of NCDs. Copenhagen, Denmark. 9–11 April 2018, www.who.int/conferences/global-ncd-conference/financing/en (accessed 10 October 2018).
-
Return to source text
Bertram M.Y, Sweeney K., Lauer J.A. et al. Investing in non-communicable diseases: an estimation of the return on investment for prevention and treatment services. The Lancet, 391:10134, 2018, pp. 2071–8. Available at: www.thelancet.com/pdfs/journals/lancet/PIIS0140-6736(18)30665-2.pdf
-
Return to source text
Dobbs R., Sawers C. and Thompson F. et al, 2014. Overcoming Obesity: An Initial Economic Analysis. McKinsey Global Institute, Jakarta, Indonesia. Available at: goo.gl/1gmauh
-
Return to source text
Tremmel, M., Gerdtham, U.G., Nilsson, P.M. and Saha, S. Economic burden of obesity: a systematic literature review. International Journal of Environmental Research and Public Health, 14:4, 2017, p. 435.
-
Return to source text
Budget analysis exercise, 2018. Exercise supported by SUN Movement Secretariat and Maximising the Quality of Scaling Up Nutrition (MQSUN)/MQSUN+ (PATH, Oxford Policy Management, Development Initiatives).
-
Return to source text
Based on the Guidance Note which countries receive that helps them conduct the exercise. Available at: http://docs.scalingupnutrition.org/wp-content/uploads/2017/11/2017-Guidance-for-Budget-Analysis-ENG.pdf.
‘Specific’ refers to high-impact nutrition actions as described in the 2013 The Lancet nutrition series that address the immediate determinants of foetal and child nutrition and development: adequate food and nutrient intake, feeding, caregiving and parenting practices, and low burden of infectious diseases. These are sometimes referred to as ‘direct’ interventions. ‘Nutrition-specific’ budget items include a nutrition department, programme, intervention or activity depending on the structure of the budget. ‘Sensitive’ refers to actions that address the underlying cause of malnutrition as set out in the UNICEF conceptual framework. They include actions from a range of sectors including: health, agriculture and food systems, water, sanitation and hygiene promotion (WASH), education and social protection. ‘Nutrition sensitive’ budget items need to include a programme that addresses the underlying causes of malnutrition and especially is beneficial to the most vulnerable populations including children and women, and clearly mention a nutrition-relevant objective and/or outcome and/or action as part of an integrated programme or department mandate.
-
Return to source text
Definitions are from The Lancet 2013 undernutrition series. Summary available at: www.thelancet.com/pb/assets/raw/Lancet/stories/series/nutrition-eng.pdf
-
Return to source text
The 25 countries are: Bangladesh, Benin, Botswana, Burundi, Chad, Comoros, Costa Rica, DRC, Gambia, Ghana, Guatemala, Guinea-Bissau, Indonesia, Kyrgyzstan, Lao People’s Democratic Republic, Lesotho, Liberia, Madagascar, Mauritania, Nepal, Pakistan, Philippines, South Sudan, Tajikistan and Zambia.
-
Return to source text
The GDP deflator is adjusted to the earliest data point, which varies for each country in the dataset. The increase or decrease in terms of allocations is in ‘real terms’.
-
Return to source text
The 13 countries are: Benin, Botswana, Burundi, Costa Rica, Gambia, Guinea-Bissau, Kyrgyzstan, Lao People’s Democratic Republic, Lesotho, Mauritania, Pakistan, South Sudan and Tajikistan.
-
Return to source text
The 12 countries are: Bangladesh, Chad, Comoros, DRC, Ghana, Guatemala, Indonesia, Liberia, Madagascar, Nepal, Philippines and Viet Nam.
-
Return to source text
The nine countries are: Guatemala, Indonesia, Lesotho, Madagascar, Mauritania, Nepal, Philippines, Tajikistan and Viet Nam.
-
Return to source text
Republic of Kenya Ministry of Health, 2016. National and County Health Budget Analysis FY 2016/17. Available at: www.healthpolicyplus.com/ns/pubs/6138-6239_FINALNationalandCountyHealthBudgetAnalysis.pdf
-
Return to source text
R4D, 2016. Tracking Nutrition Financing in Rajasthan. Available at: www.r4d.org/wp-content/uploads/Rajasthan-Nutrition-Financing-Report-2015-2016.pdf
-
Return to source text
UNICEF and the government of Balochistan, 2017. Budgetary Analysis of Balochistan Public Sector Development Program (PSDP) 2016–17 for Prioritising Both Nutrition Sensitive & Specific Interventions.
-
Return to source text
Section 5.4 authored by Mary D’Alimonte at R4D and Jordan Beecher at Development Initiatives.
-
Return to source text
DAC CRS code 12240.
-
Return to source text
OECD. DAC and CRS code lists, www.oecd.org/dac/financing-sustainable-development/development-finance-standards/dacandcrscodelists.htm (accessed 1 October 2018).
-
Return to source text
D’Alimonte M., Thacher E., LeMier R. and Clift J., 2018. Tracking aid for the WHA nutrition targets: Global spending in 2015 and a roadmap to better data. R4D. Available at: www.r4d.org/wp-content/uploads/R4D-tracking-aid-to-WHA-nutrition-targets-April-2018_final.pdf
-
Return to source text
Based on 2016 gross ODA disbursements, education refers to all spending under the DAC purpose code 110, agriculture 311 and malaria 12262.
-
Return to source text
D’Alimonte M., Thacher E., LeMier R. and Clift J., 2018 (see note 22).
-
Return to source text
The analysis tracks investment in a package of nutrition-specific interventions defined by the global Investment Framework for Nutrition including nutrition counselling, micronutrient supplementation, breastfeeding promotion, fortification of staples, diet-related NCD prevention, treatment of acute malnutrition and above service delivery investments in support of these programmes (including coordination, governance and advocacy for nutrition, capacity building for nutrition, and research and data).
-
Return to source text
Shekar M., Kakietek J., Dayton E.J. and Walters D., 2017 (see note 1).
-
Return to source text
All other basic nutrition disbursements reported earlier are for 2016. Analysis of 2016 and 2017 data is forthcoming. Data represents disbursements to all low-income, lower-middle-income and upper-middle-income recipient countries as well as regional and global disbursements unallocated by country. All figures represent gross disbursements and are in constant prices (2015) in US$ millions unless otherwise stated.
-
Return to source text
For more information on this analysis, the methods and findings, see the full technical report: R4D, 2018. Tracking aid for the WHA nutrition targets: Global spending in 2015 and a roadmap to better data. Available at: www.r4d.org/trackingWHAtargets
-
Return to source text
According to modelling estimates of the potential impact of a US$1 billion nutrition portfolio by Mathematica Policy Research and Avenir Health.
-
Return to source text
* Canada used this methodology: 1) for nutrition-specific disbursements, it used Creditor Reporting System (CRS) purpose code 12240-basic nutrition disbursements as reported to the OECD DAC; and 2) for nutrition-sensitive, it used a pre-identified subset of CRS codes linked to nutrition-sensitive outcomes to identify potential nutrition-sensitive projects, manually assessed each referred project according to the SUN criteria, and applied the associated proportional allocation to nutrition-sensitive CRS codes of validated projects. For the aggregate figure, it applied an annual average market exchange rate for 2016 to report in US$.
** At the N4G Summit, the EU committed €3.5 billion for nutrition interventions for 2014–2020. The EU used this methodology: 1) for nutrition-specific disbursements, it identified all disbursements reported to the DAC linked to nutrition-specific commitments made so far and applied the SUN methodology of 100% of the disbursement amount; and 2) for nutrition-sensitive, it identified all disbursements reported to the DAC linked to nutrition-sensitive commitments made so far and applied the SUN methodology of the proportional allocation of 100% or 25% of the disbursement amount depending on whether the related commitment had been categorised as nutrition-sensitive dominant or nutrition-sensitive partial. A commitment corresponds to a legally binding financial agreement between the EU and a partner. The disbursement figures reported by the EU are the total amounts of commitments contracted so far. Further disbursements of funds are made according to a schedule of disbursements outlined in individual contracts, progress in implementation and rate of use of the funds by the partner.
*** France reported US$4.7 million as nutrition-specific disbursements in 2015. The only difference between what France reported through the OECD DAC system and to the Global Nutrition Report is the SUN contribution, which was counted as a nutrition-specific disbursement for our reporting.
**** UK figures represent nutrition disbursements from the Department for International Development only. 2016 figure includes US$45 million of matched funding.
+ The US government’s nutrition-sensitive component is calculated differently from that of other countries. For nutrition specific, the US government uses the OECD DAC CRS purpose code 12240, which includes activities implemented through the McGovern-Dole International Food for Education and Child Nutrition Program. It also includes the portion of ‘emergency food aid’ (CRS code 72040) and ‘development food aid’ (CRS code 52010) under the Title II Food for Peace Program identified as nutrition (programme element 3.1.9) in the US government’s Foreign Assistance Framework. This programme element aims to reduce chronic malnutrition among children under 5 years of age. To achieve this goal, development partners use a preventive approach during the first 1,000 days – from pregnancy until the child is two. Programmes use a synergistic package of nutrition-specific and sensitive interventions that help decrease chronic and acute malnutrition by improving preventive and curative health services, including growth monitoring and promotion, WASH, immunisation, deworming, reproductive health and family planning, malaria prevention and treatment.
++ The World Bank does not submit disbursements to the Global Nutrition Report and reports only on commitments through the N4G process. Historic US data has been revised in line with updated donor reporting and to maintain consistent methodology across all years.
+++ While Australia made nutrition investments in 2015, these have not been calculated or reported for publication in the Global Nutrition Report, to which Australia reports biennially.
++++ German figures represent nutrition disbursements from the Federal Ministry for Economic Cooperation and Development and the Federal Ministry of Food and Agriculture.
§ Switzerland does not use the Basic Nutrition Code and thus reports 0 for nutrition-specific spending.
-
Return to source text
Authored by Katie Dain of the NCD Alliance.
-
Return to source text
UN Development Programme and Overseas Development Institute, 2012. Climate Public Expenditure and Institutional Review (CPEIR): a methodological note. Available at: www.odi.org/publications/6191-climate-public-expenditure-and-institutional-review-cpeir-methodological-note
-
Return to source text
Nutrition for Growth. Nutrition for Growth Commitments: Executive Summary. Available at: https://assets.publishing.service.gov.uk/government/uploads/system/uploads/attachment_data/file/207271/nutrition-forgrowth-commitments.pdf
-
Return to source text
UN General Assembly, 2018. Political declaration of the third high-level meeting of the General Assembly on the prevention and control of non-communicable diseases. Available at: www.un.org/ga/search/view_doc.asp?symbol=A%2F73%2FL.2&Submit=Search&Lang=E
-
Return to source text
Contributed by Trudy Wijnhoven and Lina Mahy from FAO and WHO respectively.
-
Return to source text
SMART means specific, measurable, achievable, relevant and time bound.
Guidelines for creating SMART commitments: https://globalnutritionreport.org/documents/469/SMART_Guidelines.pdf
-
Return to source text
WHO. Global database on the Implementation of Nutrition Action (GINA). Commitments by country, https://extranet.who.int/nutrition/gina/en/commitments/summary (accessed 10 October 2018).
-
Return to source text
N4G Annex of Commitments, 2017. Available at: https://nutritionforgrowth.org/wp-content/uploads/2017/11/Annex-of-Commitments.pdf